 Ever notice that people who do a lot of split testing seem really, REALLY excited about it? They’re like an excited kid in a candy store when you ask them what they’re going to test next.
Now if you haven’t done any split testing yet, you might be wondering what all the hubbub is about. Why is everyone so excited?
Take a look at these 5 reasons so many others are excited about split testing and why you will be too…
1. Split Testing Boosts Conversions
Whether you need a conversion boost on your opt-in page, a webinar registration page, a contest page or your sales page, split testing is the way to do it.
And once you start boosting your conversions across the board, then you start enjoying all sorts of wonderful benefits. These benefits include:
• Building your mailing list more quickly.
• Getting more people to open your e-mails, read them, and click on the links.
• Generating more sales on both your frontend and backend products.
• Creating a bigger list of proven customers.
• Improving your advertising ROI.
• Growing your revenue and your business.
In short, split testing is extremely profitable!
Here’s another reason to get excited about split testing…
2. Split Testing is Easy To Do
If you’ve done any reading about testing, then you may have run into discussions about things such as multivariate testing. And these discussions almost always talk about how you have to design your tests and analyze them very carefully.
Guess what?
Split testing can deliver the same results as multivariate testing, but without all the design and interpretation hassles. And that makes split testing a good option for both beginners and experts.
Here’s something else…
3. Split Testing Delivers Fast Results
Nothing gets your heart racing faster than seeing the results of a split test, and realizing how much more money these results will slide into your pocket.
And best of all, split testing delivers these results to you fast in as little as a few days to a week. That means you can start profiting instantly from your results. For example…
Did you just discover which headline is going to triple your conversion rate? Boom, you can start enjoying that sales and revenue boost instantly once your test is done.
Simply put, split testing is one of the fastest ways to grow your business!
4. Split Testing Gives You a Better Understanding Of Your Market
One you start doing some split testing, you’re going to quickly realize what your audience responds to.
You’ll find out how to create targeted messaging that resonates with them. You’ll find out what sorts of products they really want. You’ll learn more about what sort of pricing gets them clicking that order button.
This sort of deep understanding of your customers helps you tremendously. From here on out, you’ll have your audience’s rapt attention every time you post on social media, every time you publish a blog post, every time you send an e-mail.
That’s priceless!
5. Split Testing Tools Make Getting These Benefits Even Easier
It used to be that you needed to install and customize clunky, buggy scripts on your website just to run a split test. Today you don’t need to do anything like that.
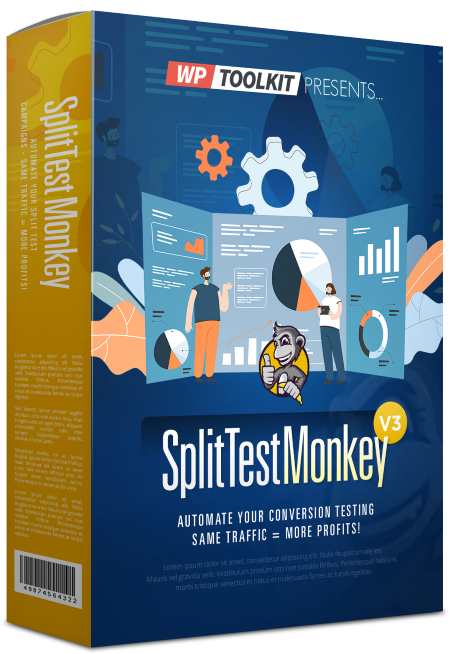
That’s because so many of the split testing tools like Split Test Monkey are web-based apps all you have to do is log in, and with just a few clicks of your mouse you can have your first split testing up and running fast.
Bottom line? If you want to get more opt-ins, sales, customers and revenue, then you’ll want to start split testing too. And there’s no better way to get started than by using Split Test Monkey.
Use the coupon code MONKEY20 to get a cool 20% discount!
Split Test Monkey is a brand new software released by Jeremy Gislason and Simon Hodgkinson. I give you another 6 key reasons why this is ESSENTIAL for anyone with an online business:
1) Unlimited Split Tests: There’s no limit to the number of tests you can create, or the number of domains you can run them on.
2) Unlimited Visitors: Unlike other services that want to “nickel & dime” you, there’s no cap on the number of visitors/clicks you get.
3) Set-&-Forget Testing: This is my *favorite feature* because you can run tests on full auto-pilot, and the software will pick the winner for you (hassle-free optimizations).
4) Built-In Reporting: Use the built-in reporting to understand customers and quickly make smarter decisions to boost your bottomline profits.
5) Nothing To Install: Split Test Monkey is so easy to use, there’s nothing to install or anything complicated to configure; just login and start testing in minutes.
6) ZERO Monthly Fees: This is HUGE right now with the special ‘Early Adopter’ access you’ll never have to pay monthly and the software comes with free updates for life.
But that’s really just the start of how good this is…
There are 2 types of test you can run (split URL testing or dynamic snippet testing) which make it super flexible for whatever you want to test…And there’s even 3 different ways to test—full autopilot (like I mentioned above this is my favorite feature), conversion races (which are a lot of fun) or manual testing (to really get your ‘geek’ on).
Split Test Monkey is simple, but it’s POWERFUL, and it will make all the difference to you and your conversion rates, so that you can watch your business grow rapidly as a result!
Today might be the day you finally see split testing as simple, quick and yes, even fun. Don’t forget to use the 20% off discount code MONKEY20 at checkout!


 Google Analytics